|
Home
Services
About
Us
Projects
Contact
Us
Disclaimer
|
Example: A two compartment vascular/tissue model for drug
concentration
Please allow scripts to run on this page to format the
mathematical notation.
For this example, an optimal drug profile for the vascular compartment of a
two compartment vascular/tissue model is desired. The differential equations
for a two compartment vascular/tissue model of drug
metabolism with exchanges between the two compartments and loss from
the vascular compartment are
$$\frac{dC_1}{dt} = -k_{12}C_1(t) +
k_{21} C_2(t) -k_{10}C_1(t)$$
$$\frac{dC_2}{dt} = k_{12}C_1(t) -
k_{21} C_2(t) $$
with rate constants $k_{ij}>0$ and the initial
conditions $C_1(0) = C_{10}$ and $C_2(0) = C_{20}$. The
concentration $C_1$ represents the vascular drug compartment and the
concentration $C_2$ represents the tissue drug compartment, with
$k_{12}$ representing the rate of exchange from compartment $C_1$ to
compartment $C_2$, $k_{21}$ representing the rate of exchange
from compartment $C_2$ to compartment $C_1$, and $k_{10}$
representing the rate of loss from the compartment $C_1$.
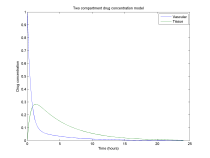 |
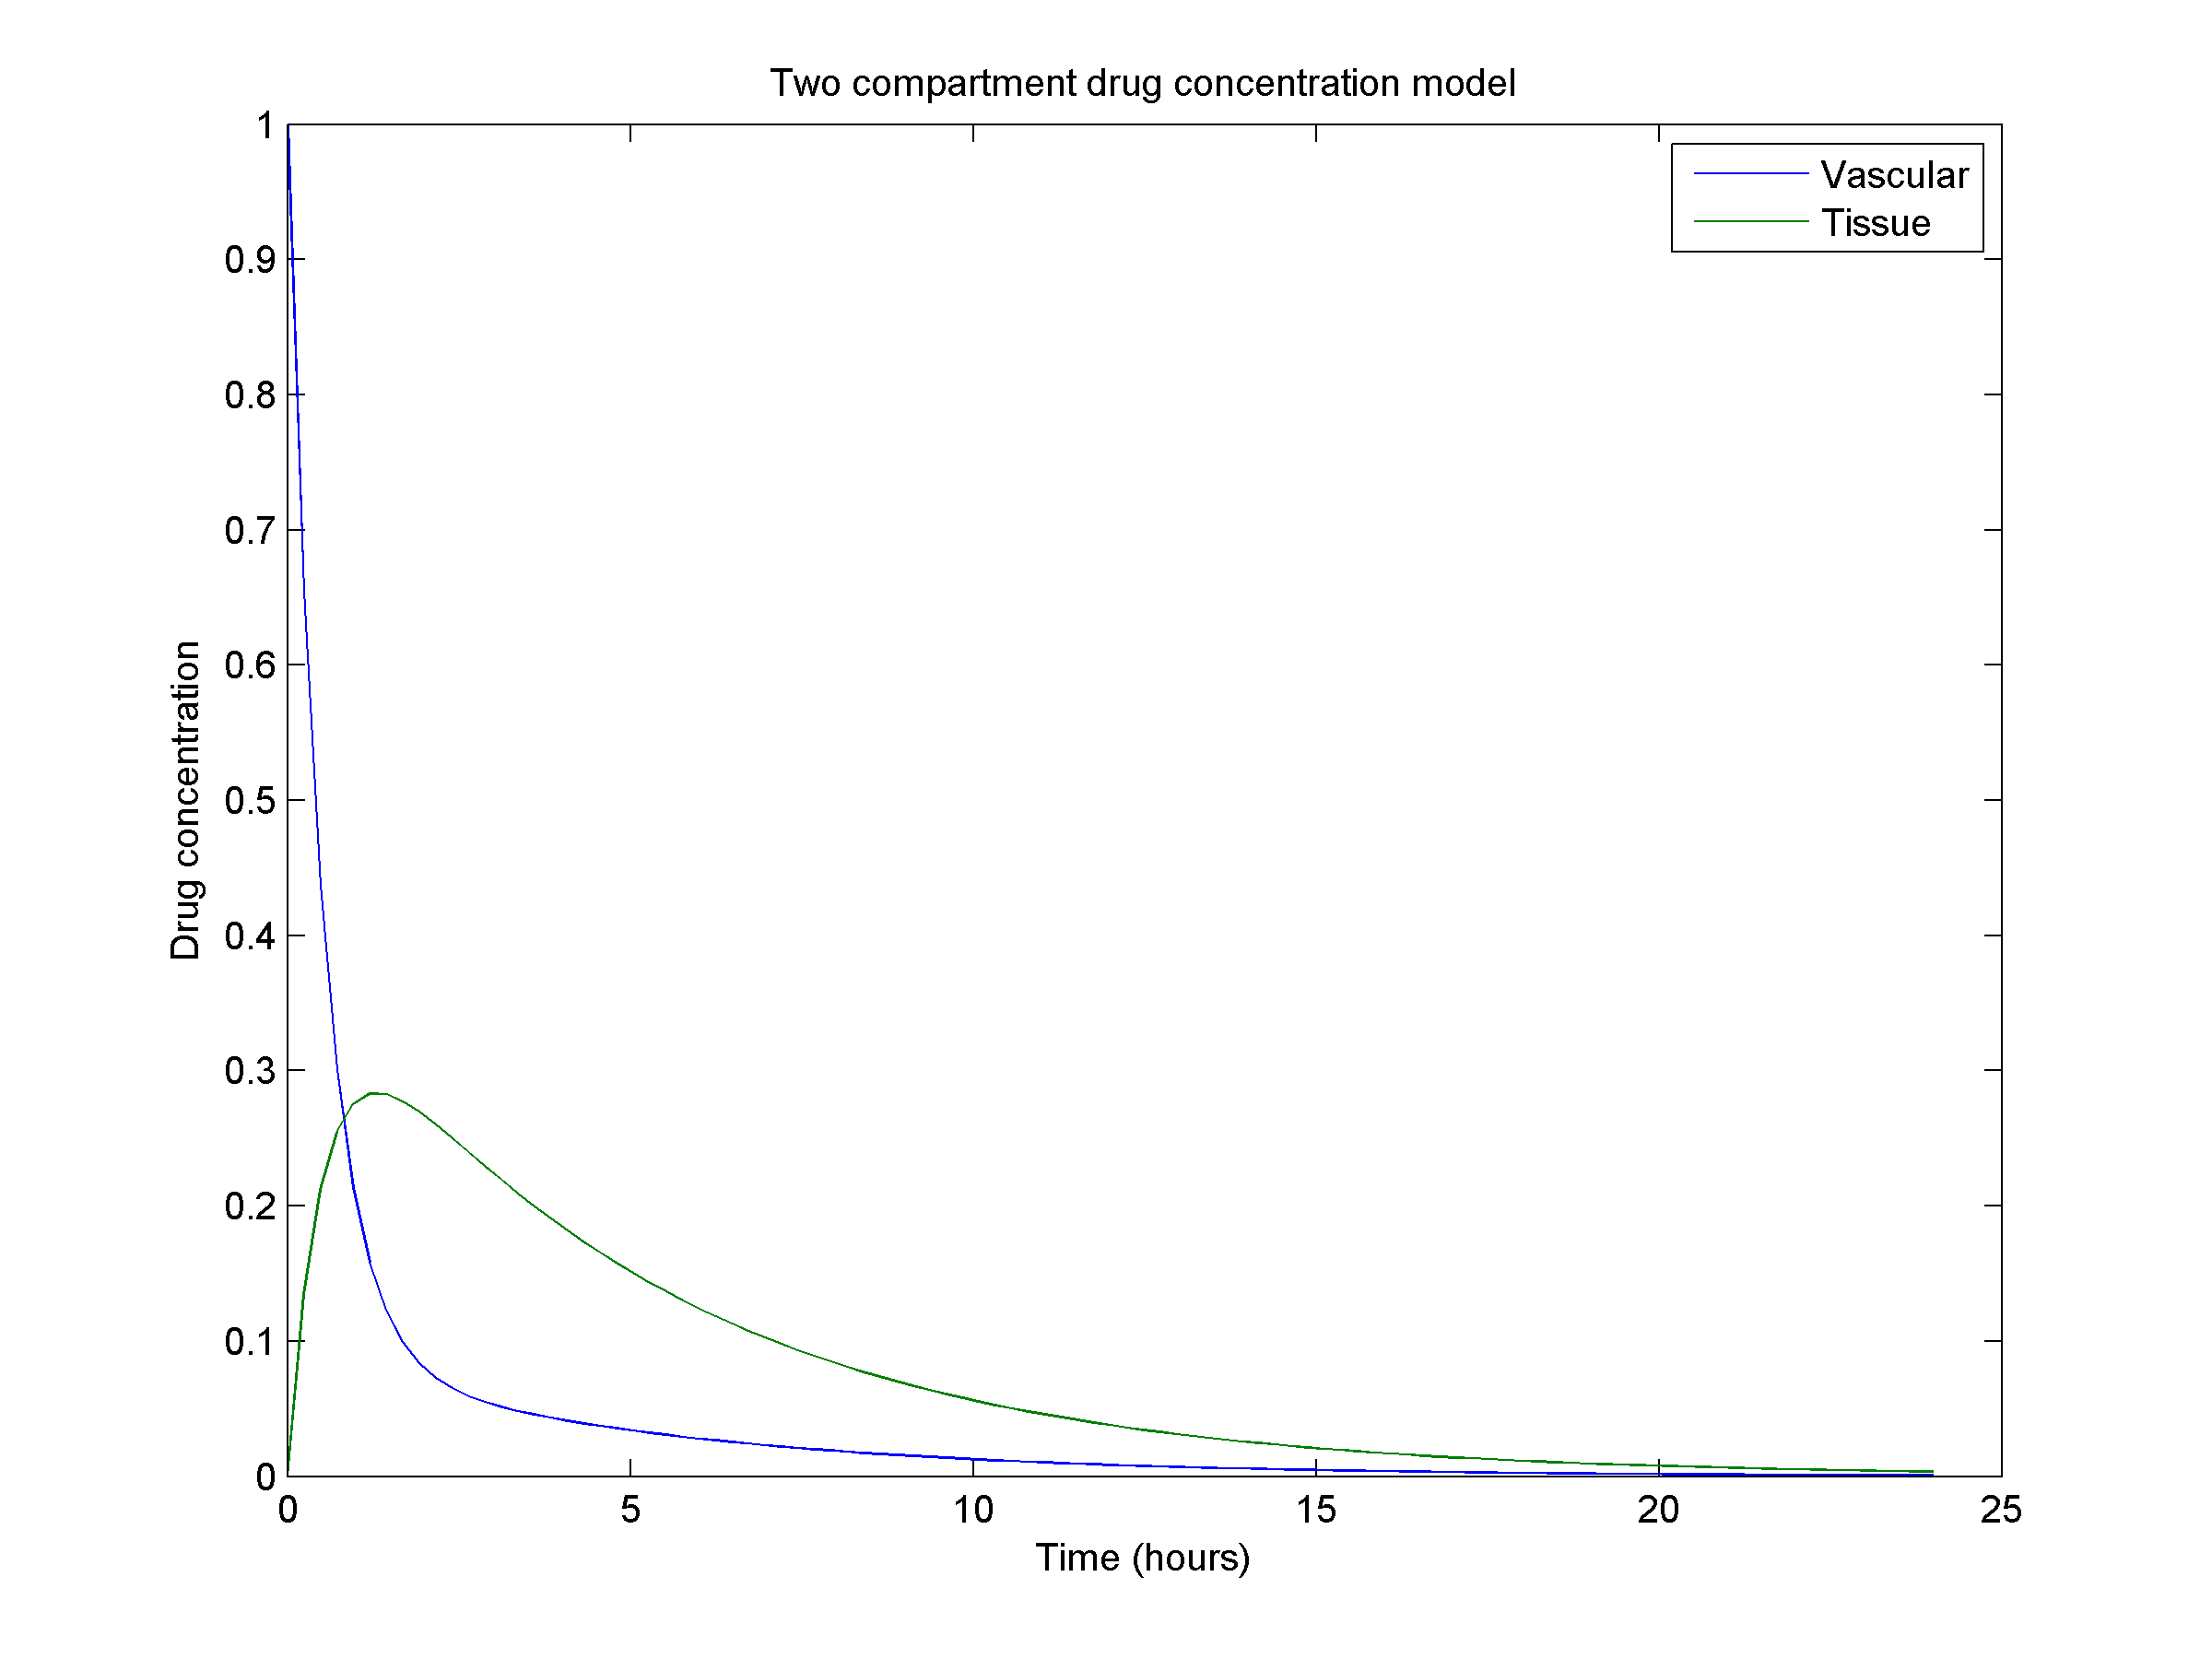
The two compartment model for drug concentration
over time from an initial dose of one unit of a drug. |
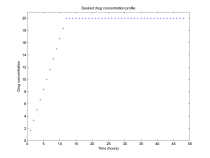 |
The desired drug input profile for the vascular
compartment. This profile achieves a vascular drug
concentration of 20 units over a 12 hour time period,
maintaining the 20 unit concentration for the next 36 hours,
after which the drug input is stopped. |
 |
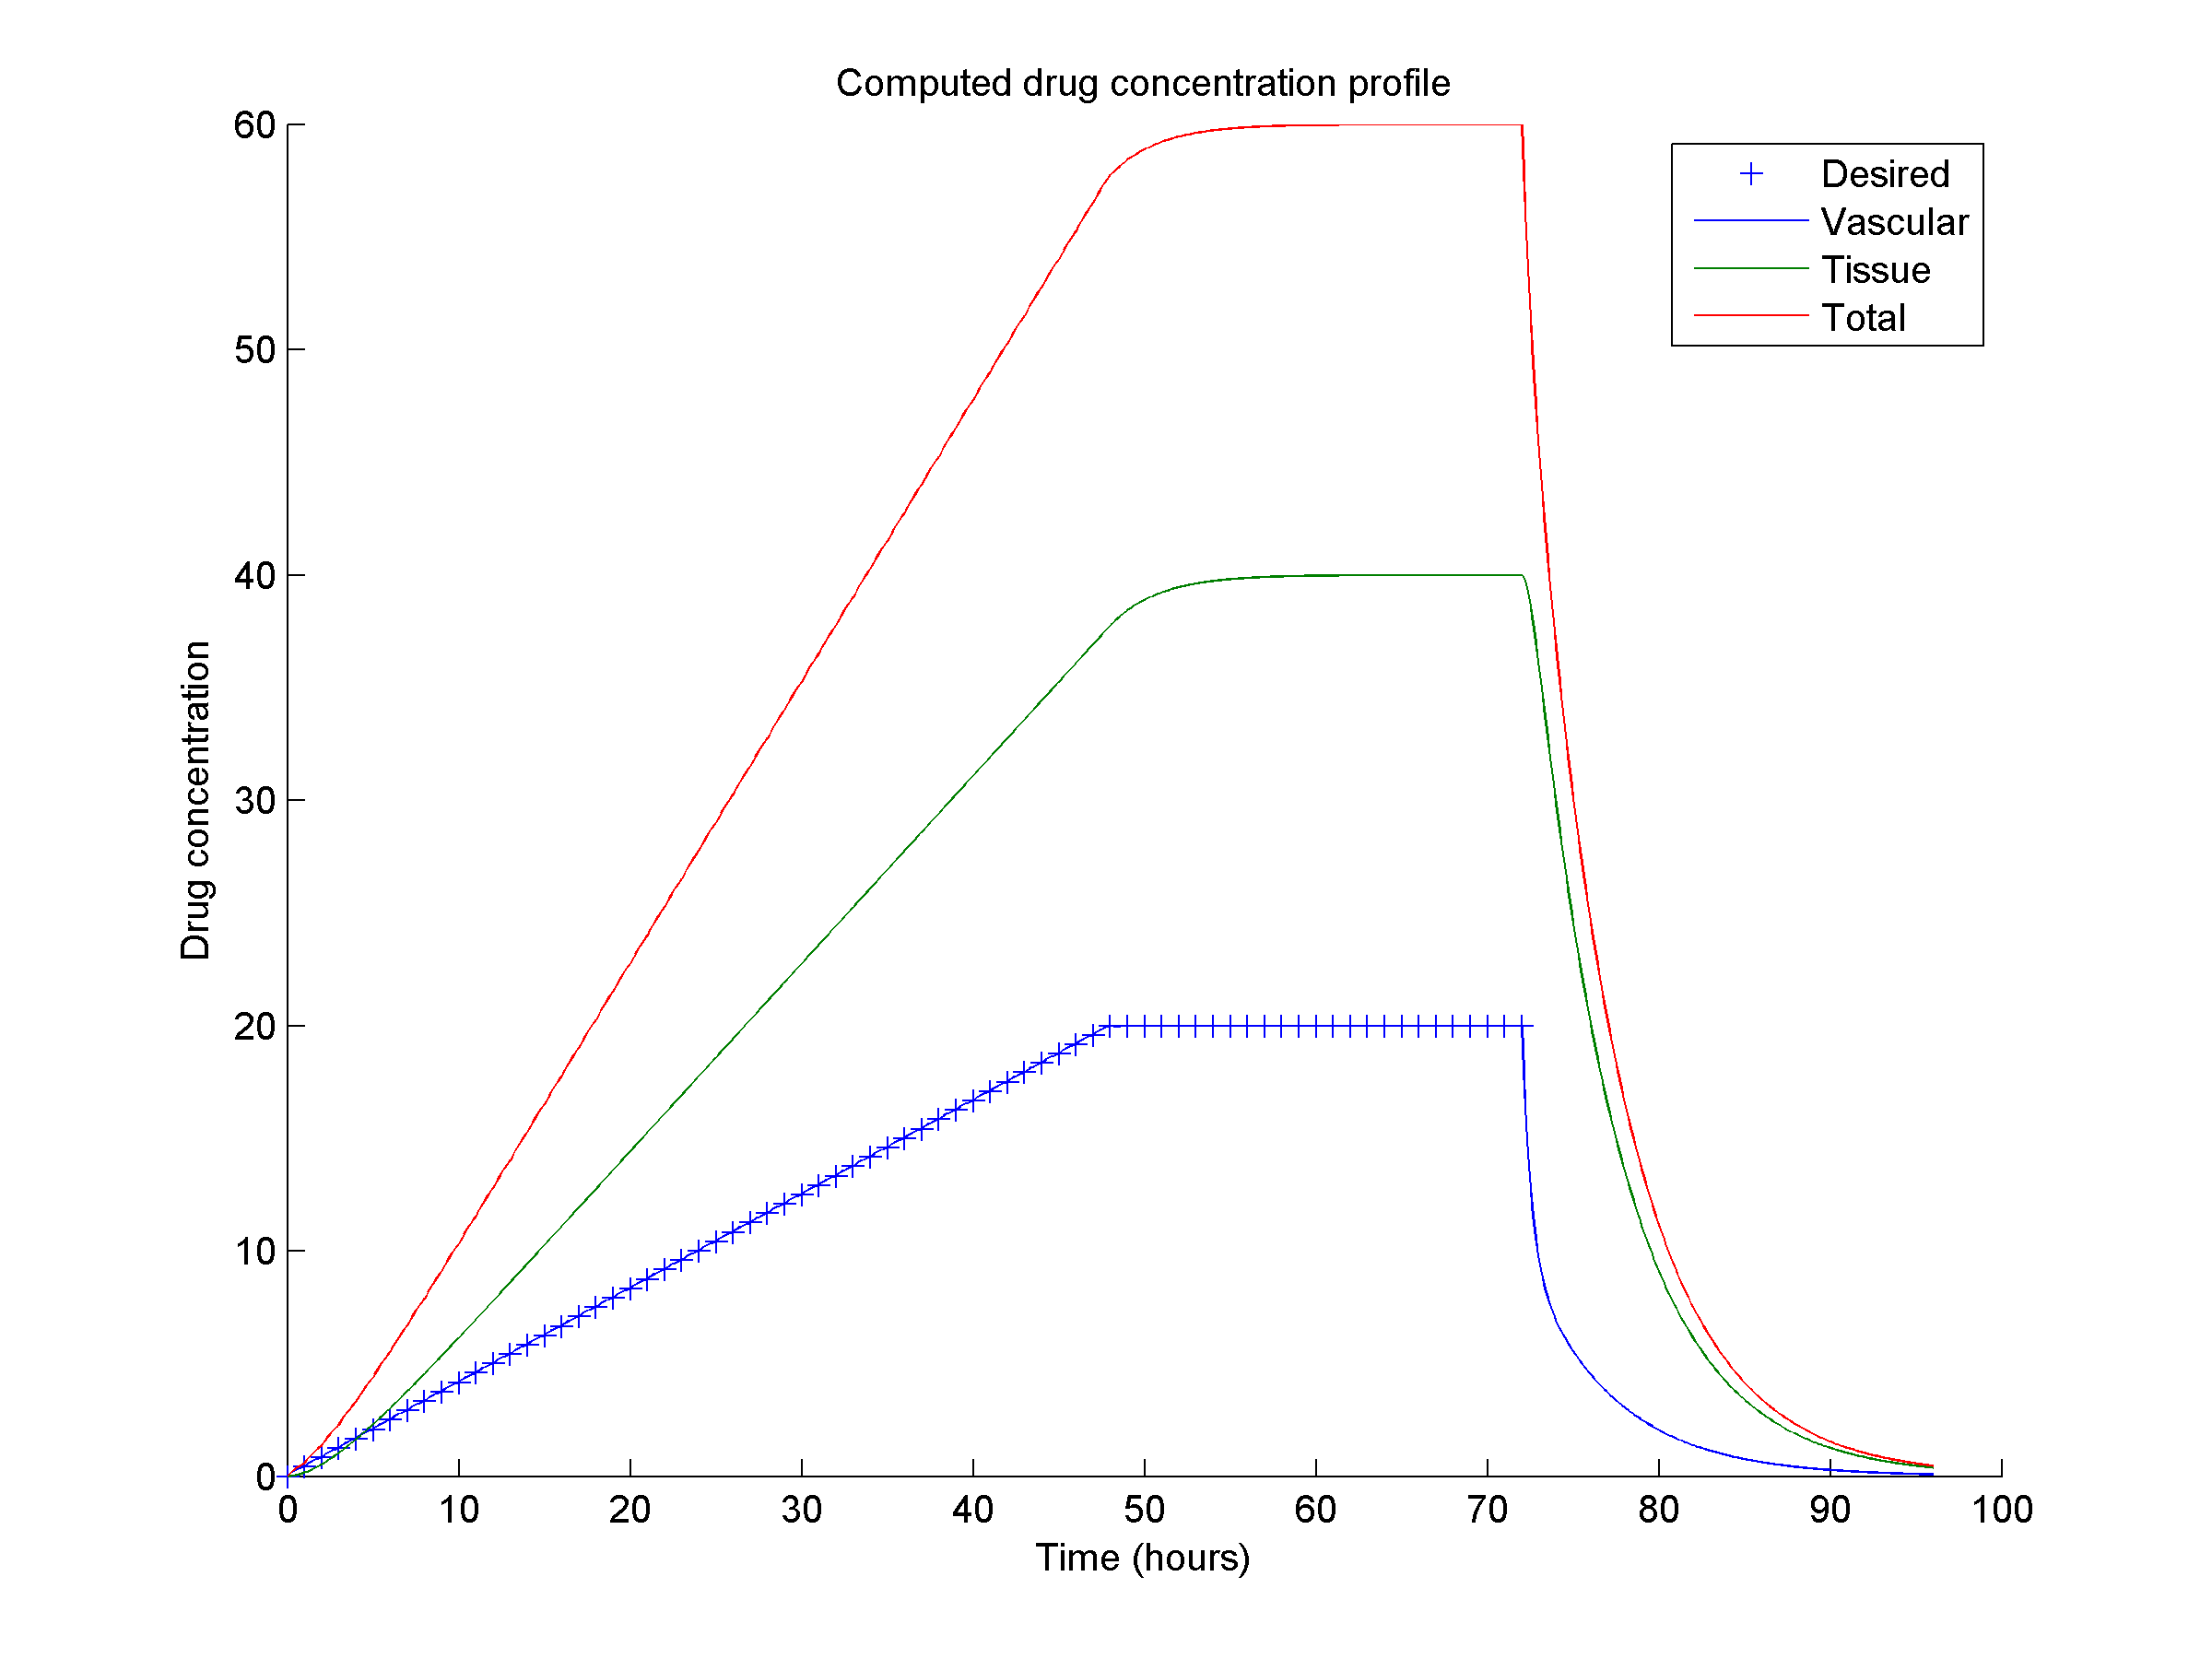
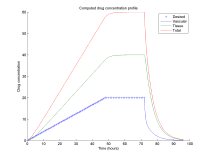
The computed drug input profile with the desired profile
over a 72 hour time period. The computed profile matches the
desired profile over the first 48 hours, after which the drug
input was halted and the vascular and tissue drug
concentrations decrease. |
 |
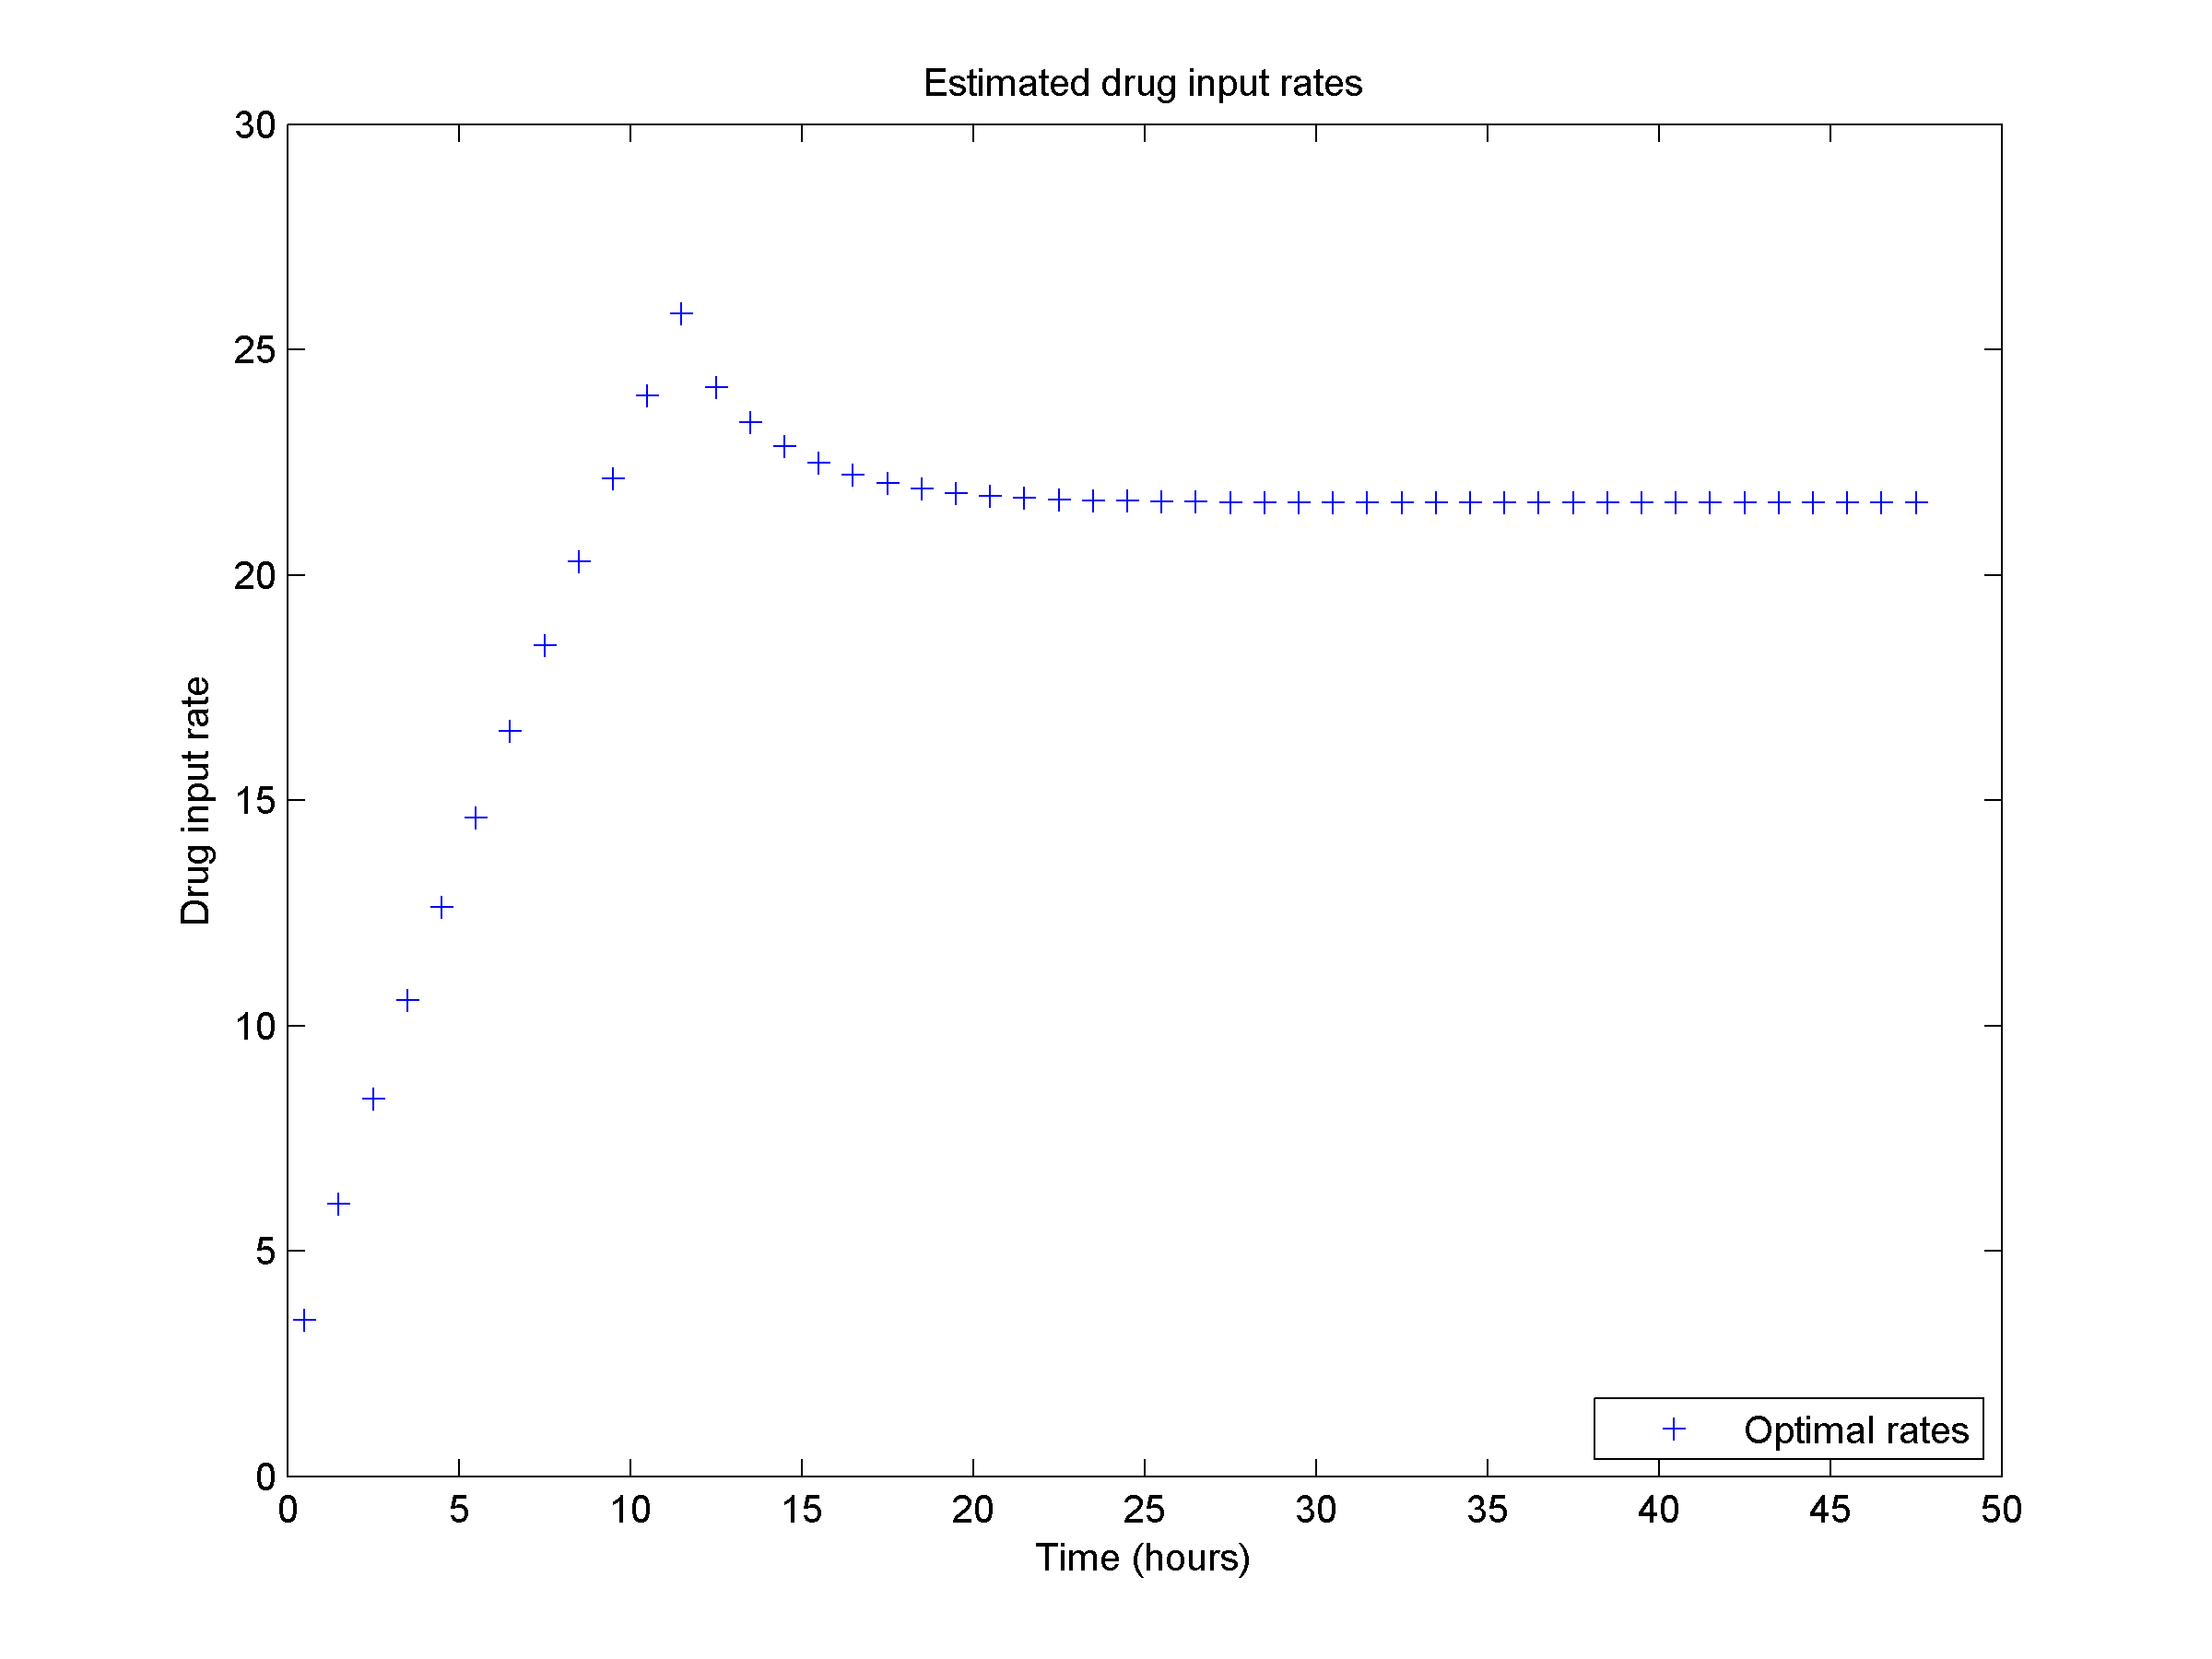
The constant drug input rates for each one hour time
interval over the 48 hour time period for the desired profile. |
 |
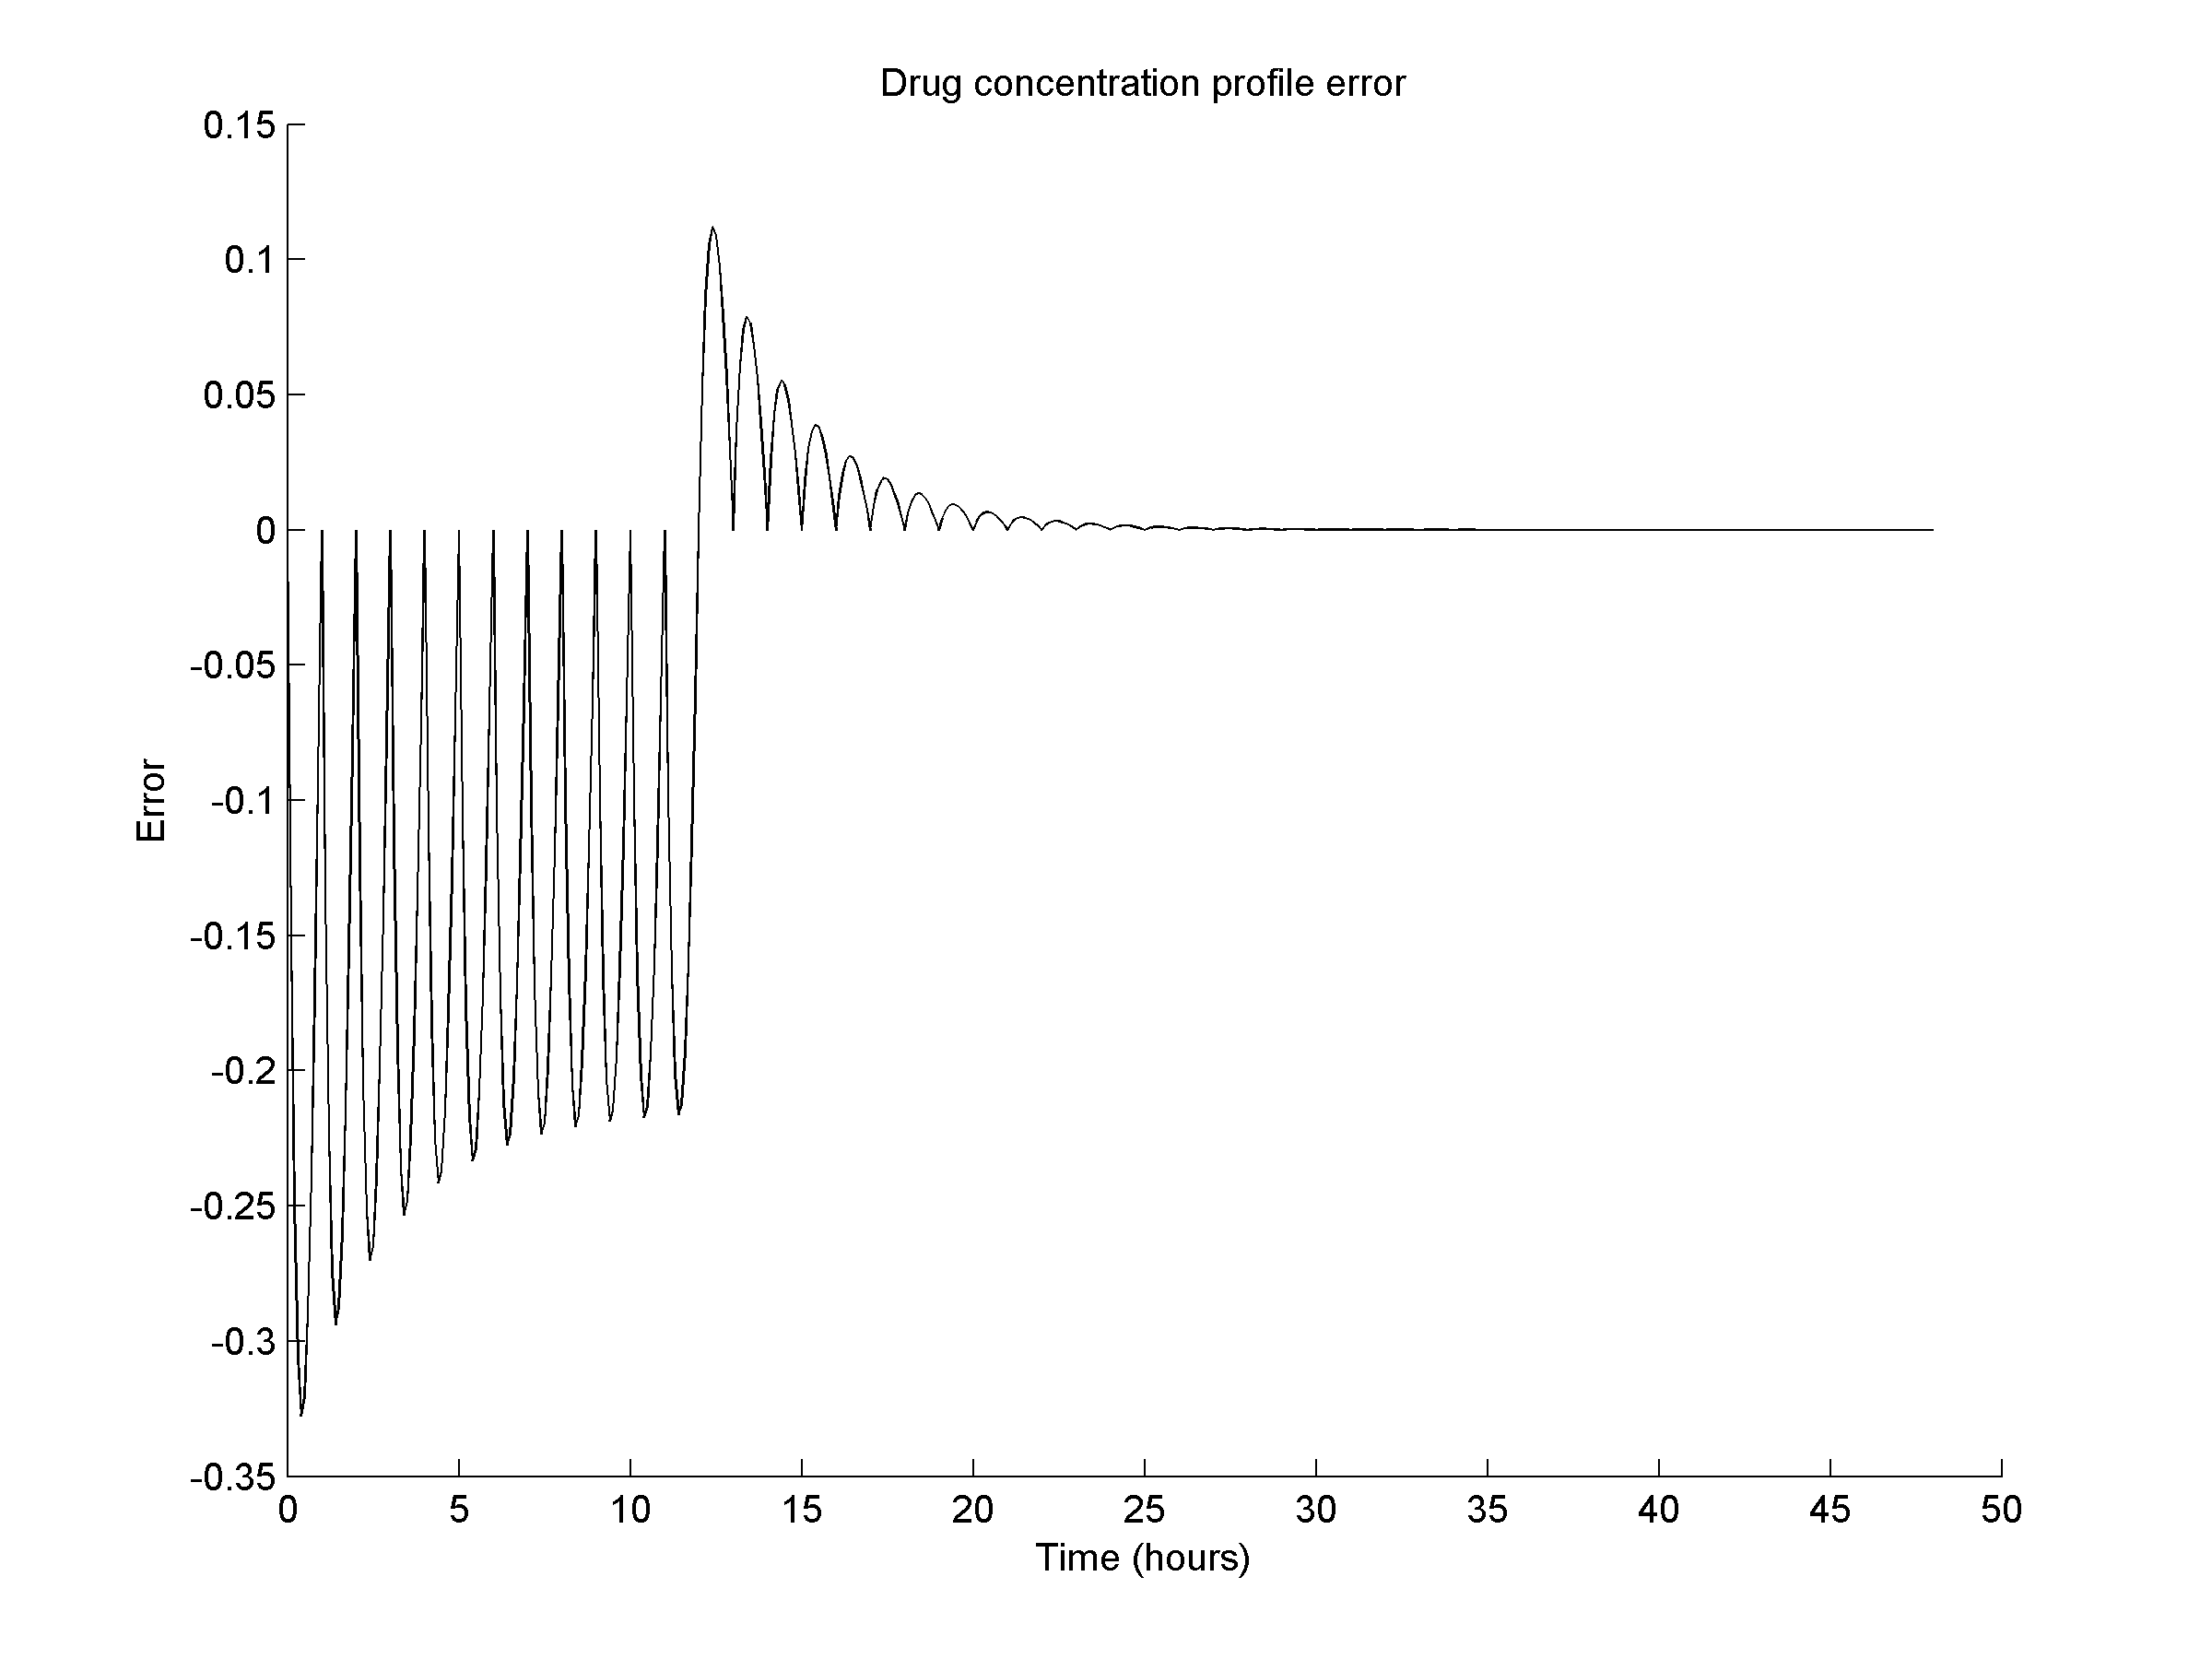
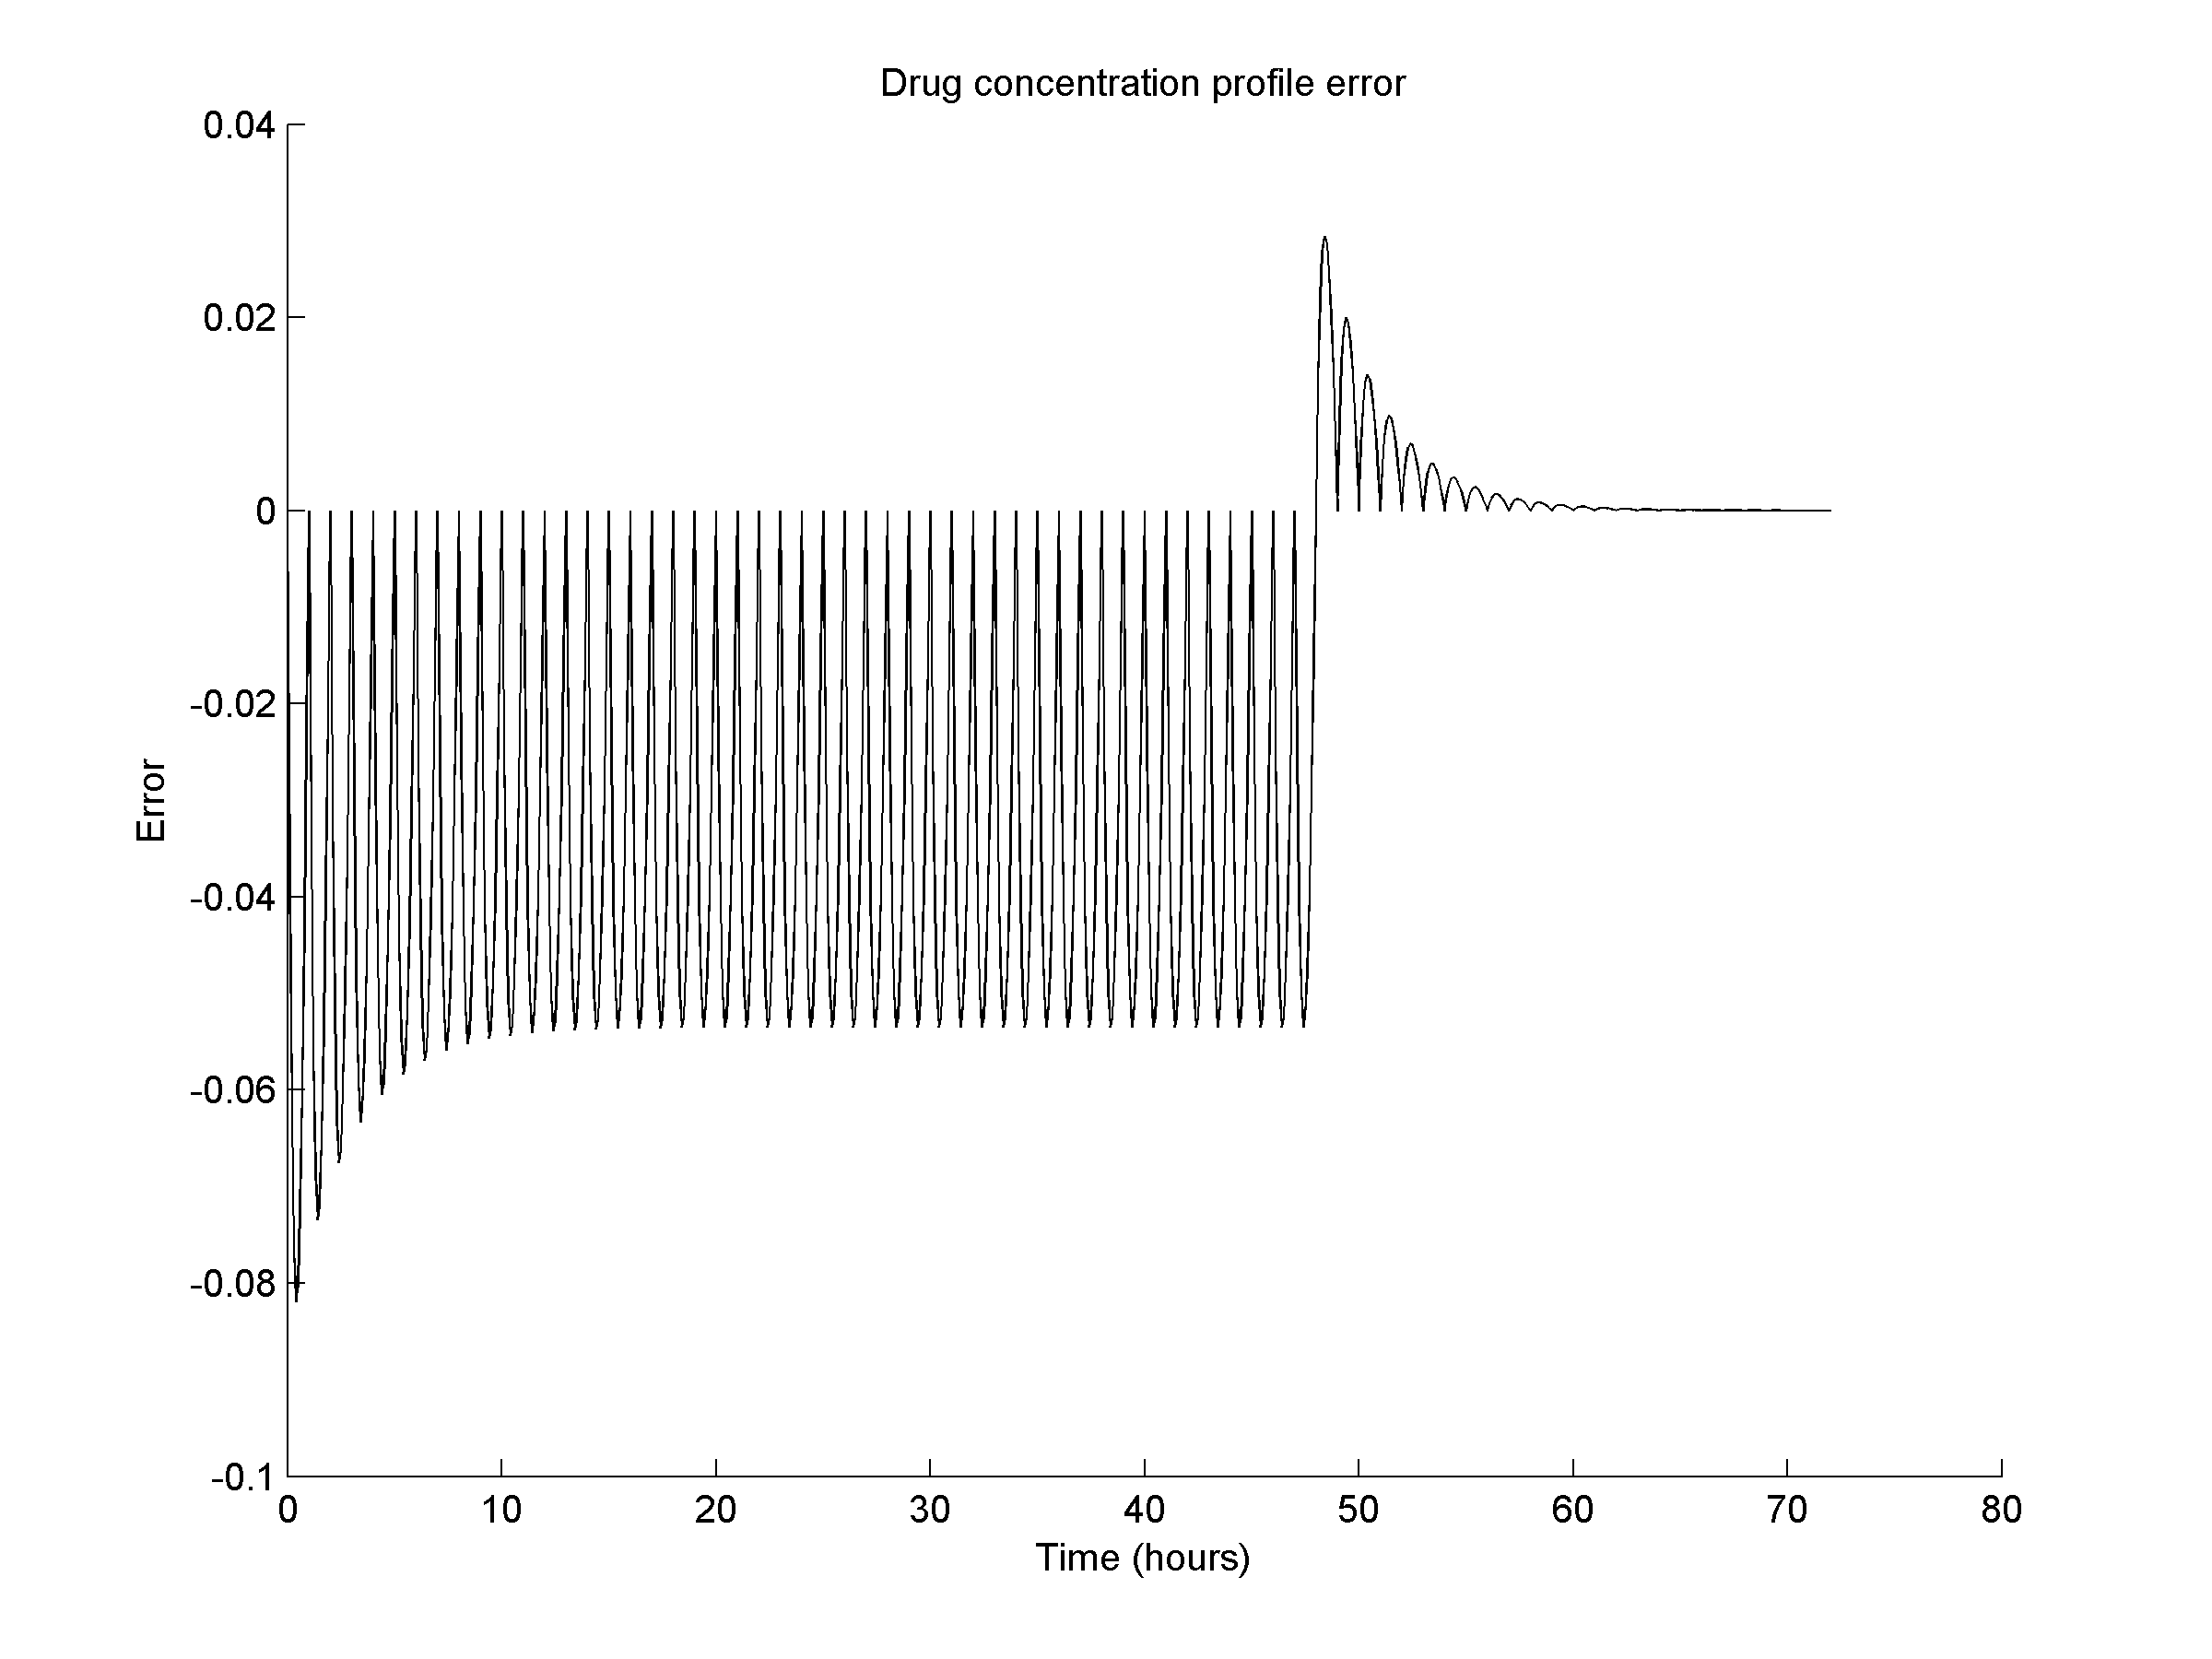
The drug concentration deviations for the computed profile
relative to the desired drug profile. The deviations were
computed as the desired profile minus the computed profile.
The deviations observed for the computed profile during the
first 12 hours are due to the nonlinearity of the drug
concentration caused by the loss, exchanges between the
compartments, and the relatively steep slope of the drug input
profile. After 12 hours the deviations are due to the
corrections necessary to achieve a constant vascular drug
concentration after a rapid ramp up. A shallower slope and a
longer ramp-up period for the drug concentration would reduce
these deviations. |
 |
Computed drug profile for a 48 hour ramp up time to a 20
unit vascular drug concentration and a 24 hour constant
concentration. |
|
|
The constant drug input rates for each one hour time
interval over the 72 hour time period for the 48 hour drug
concentration ramp up profile. |
|
|
The drug concentration deviations for the 48 hour drug
concentration ramp up profile. Again, there are nonzero
deviations, but they are significantly smaller due to the long
ramp-up time. |
|