Biometrics Northwest LLC
Performing Data Analysis and Modeling
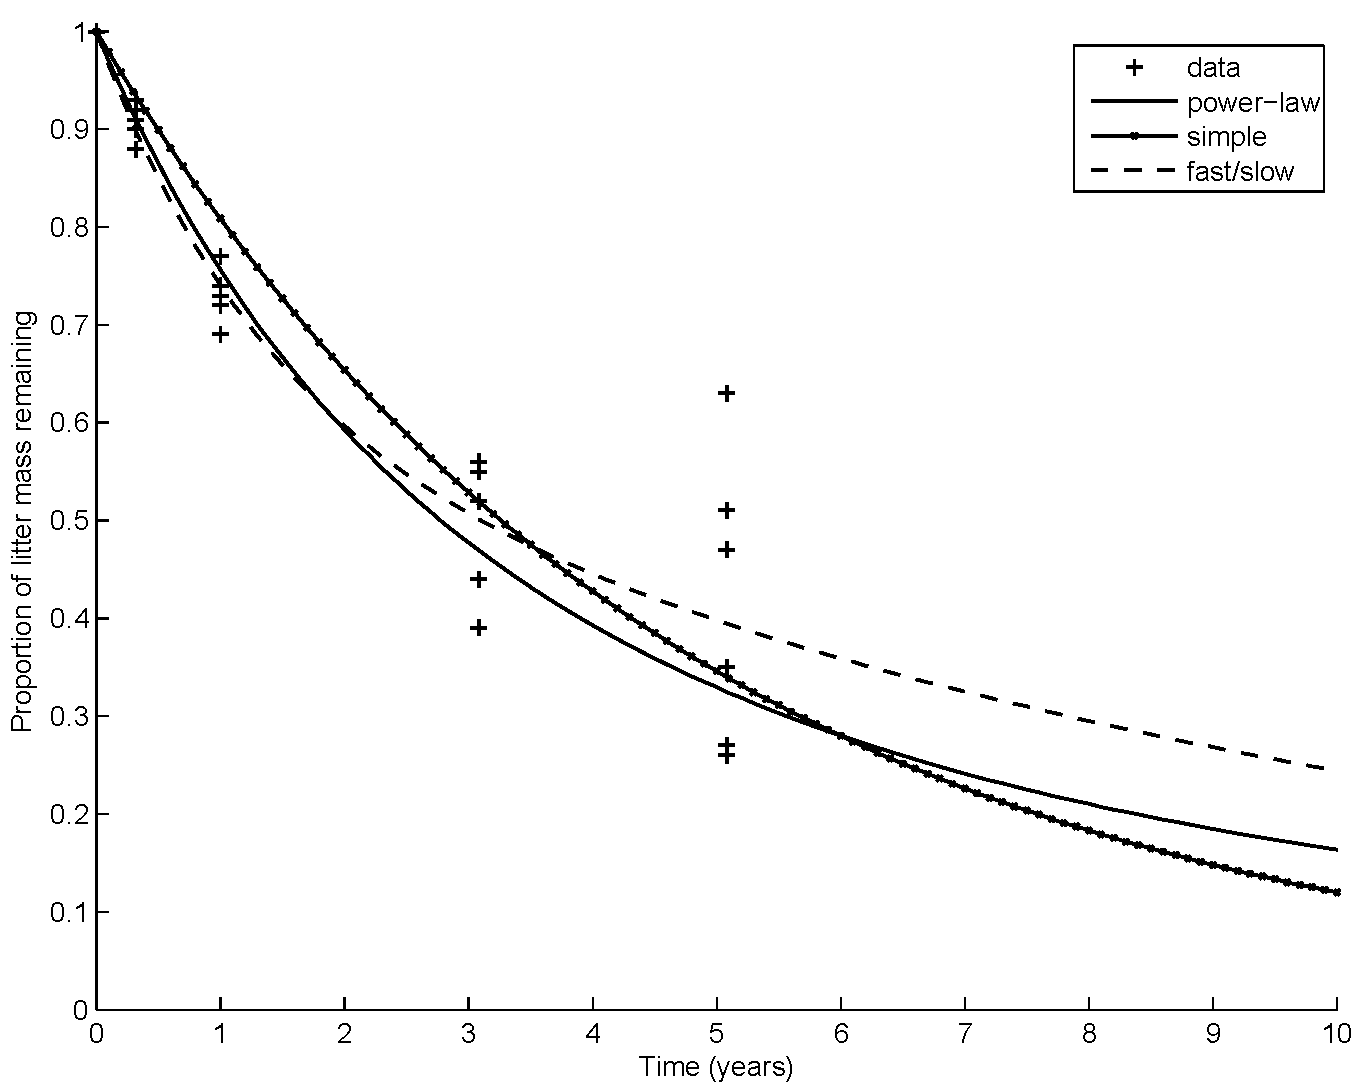
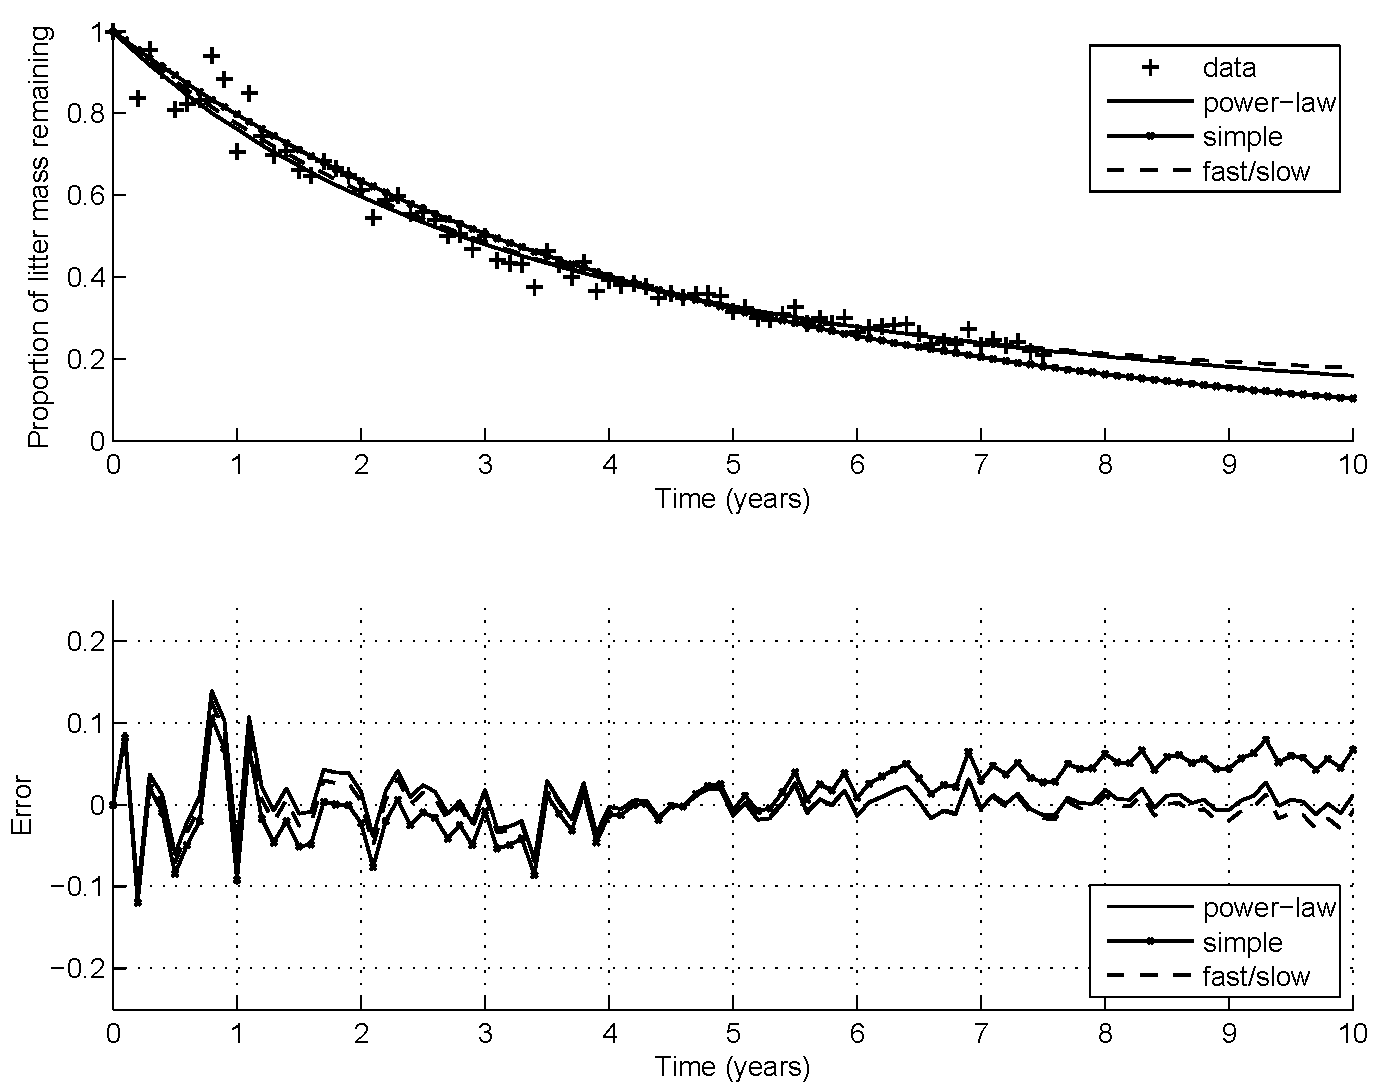
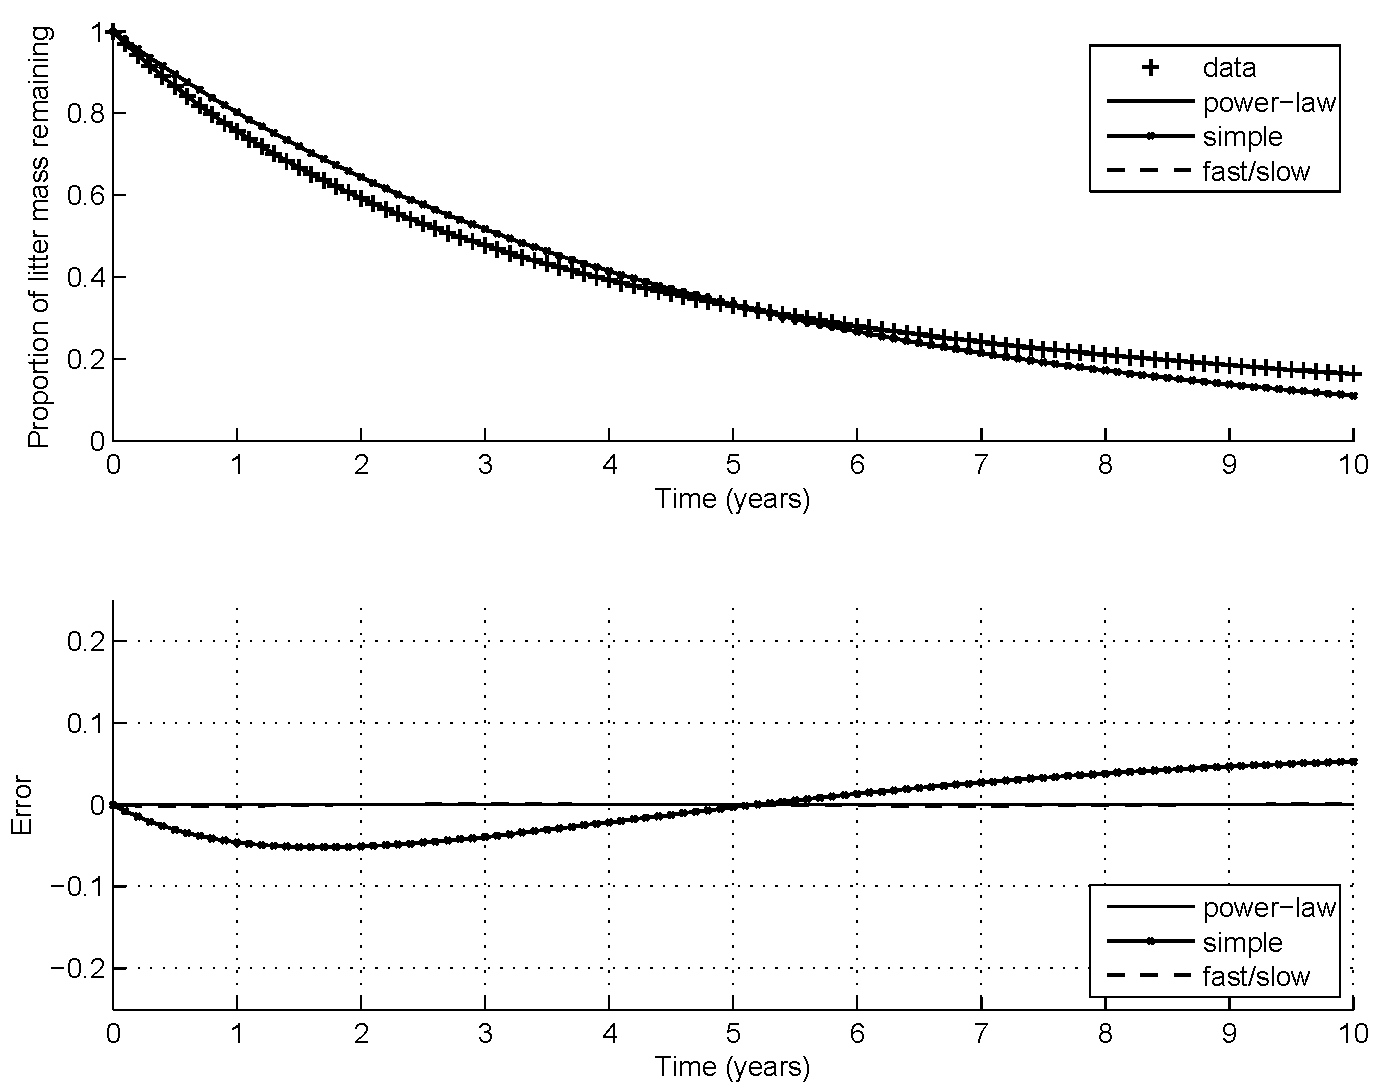
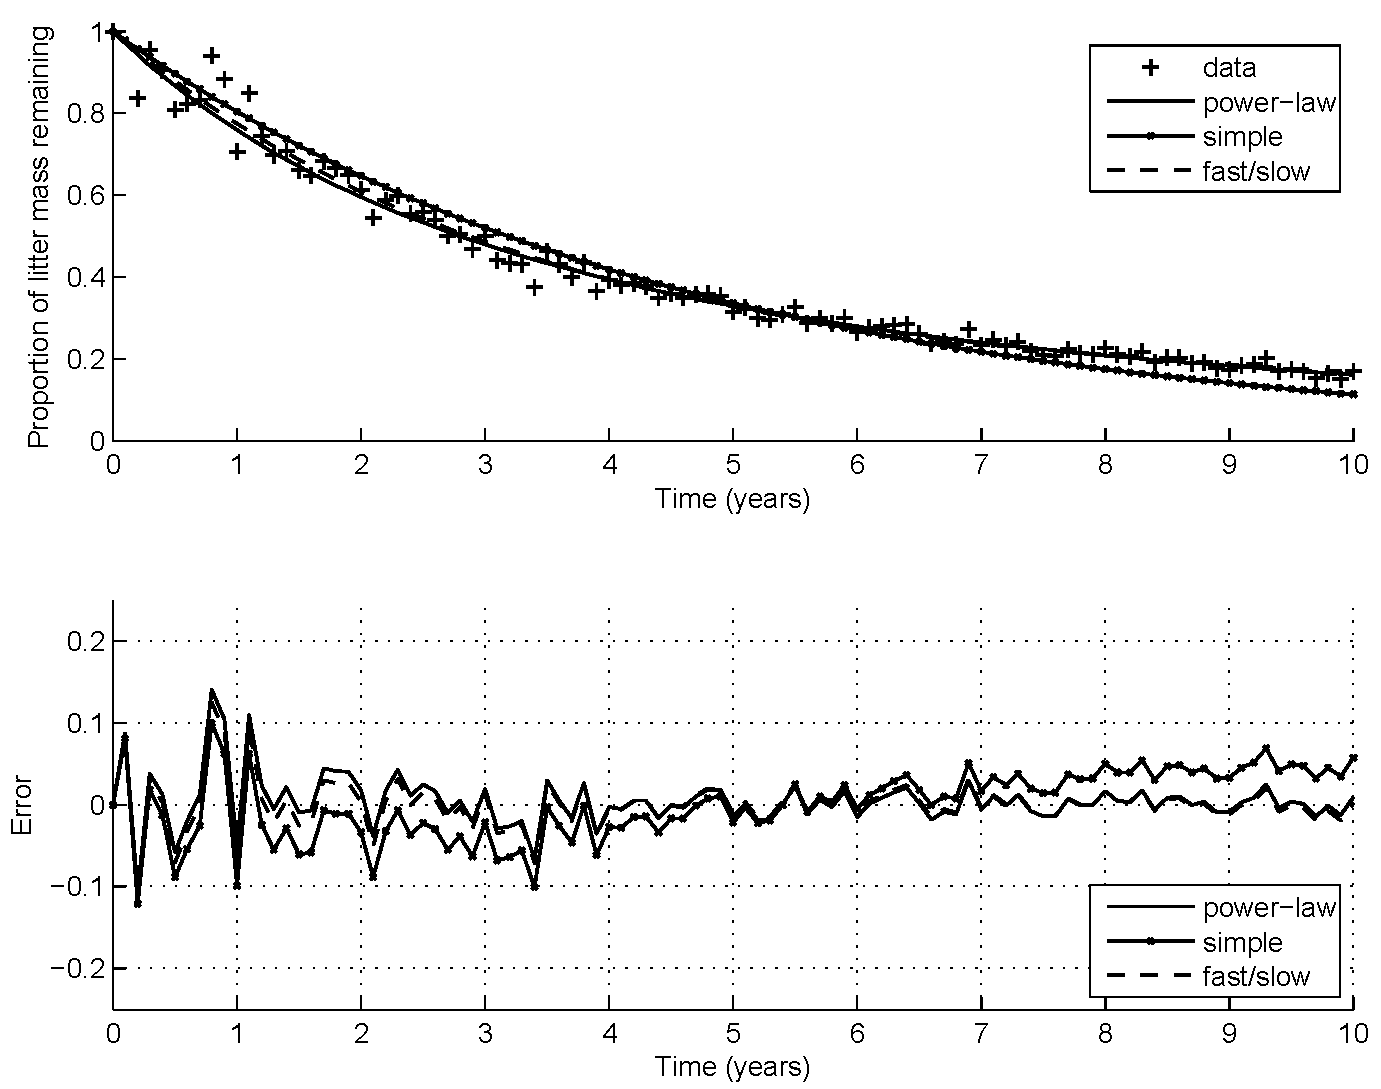
Example: Modeling mass loss due to decompositionA new decomposition model representing litter mass remaining after time t is developed. The new decomposition model was derived by evaluating the assumptions and limitations of the commonly used simple exponential decay model to derive a power-law generalization as a nonlinear di erential equation. A closed form or integrated solution of the new model is also derived for completeness. The power-law model is shown to perform better than the simple exponential decay model for long term projections, and it performed as well as a two compartment, double exponential decay decomposition model representing fast and slow decomposition fractions without the need to assume a second compartment. A draft of the paper is available. Please see the paper for model formulations and parameter descriptions.
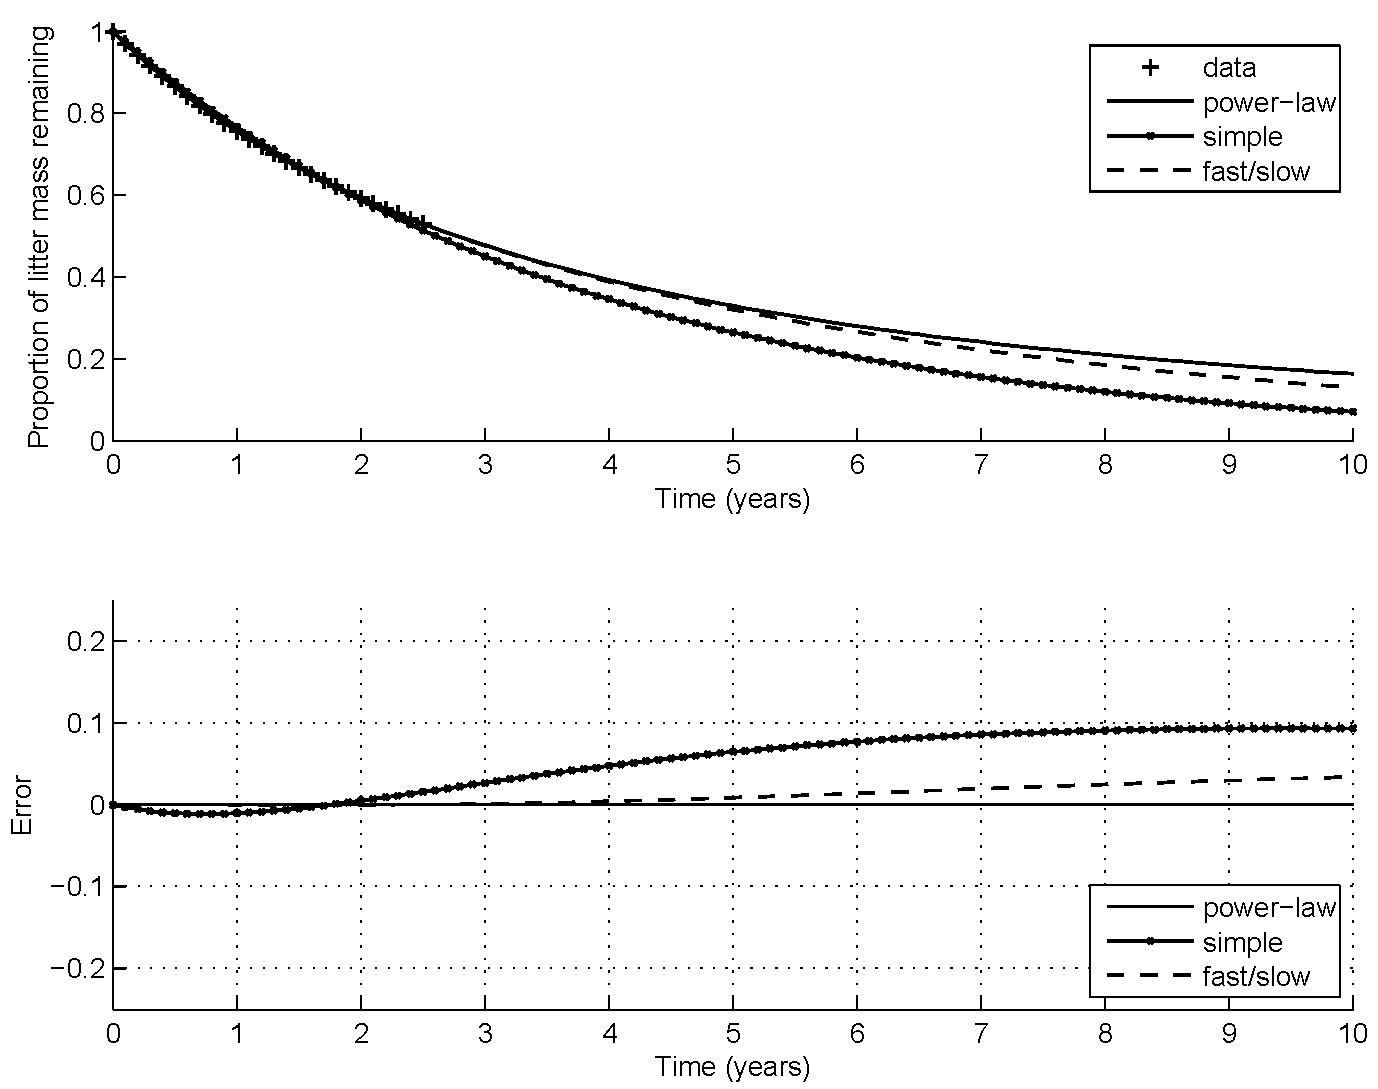
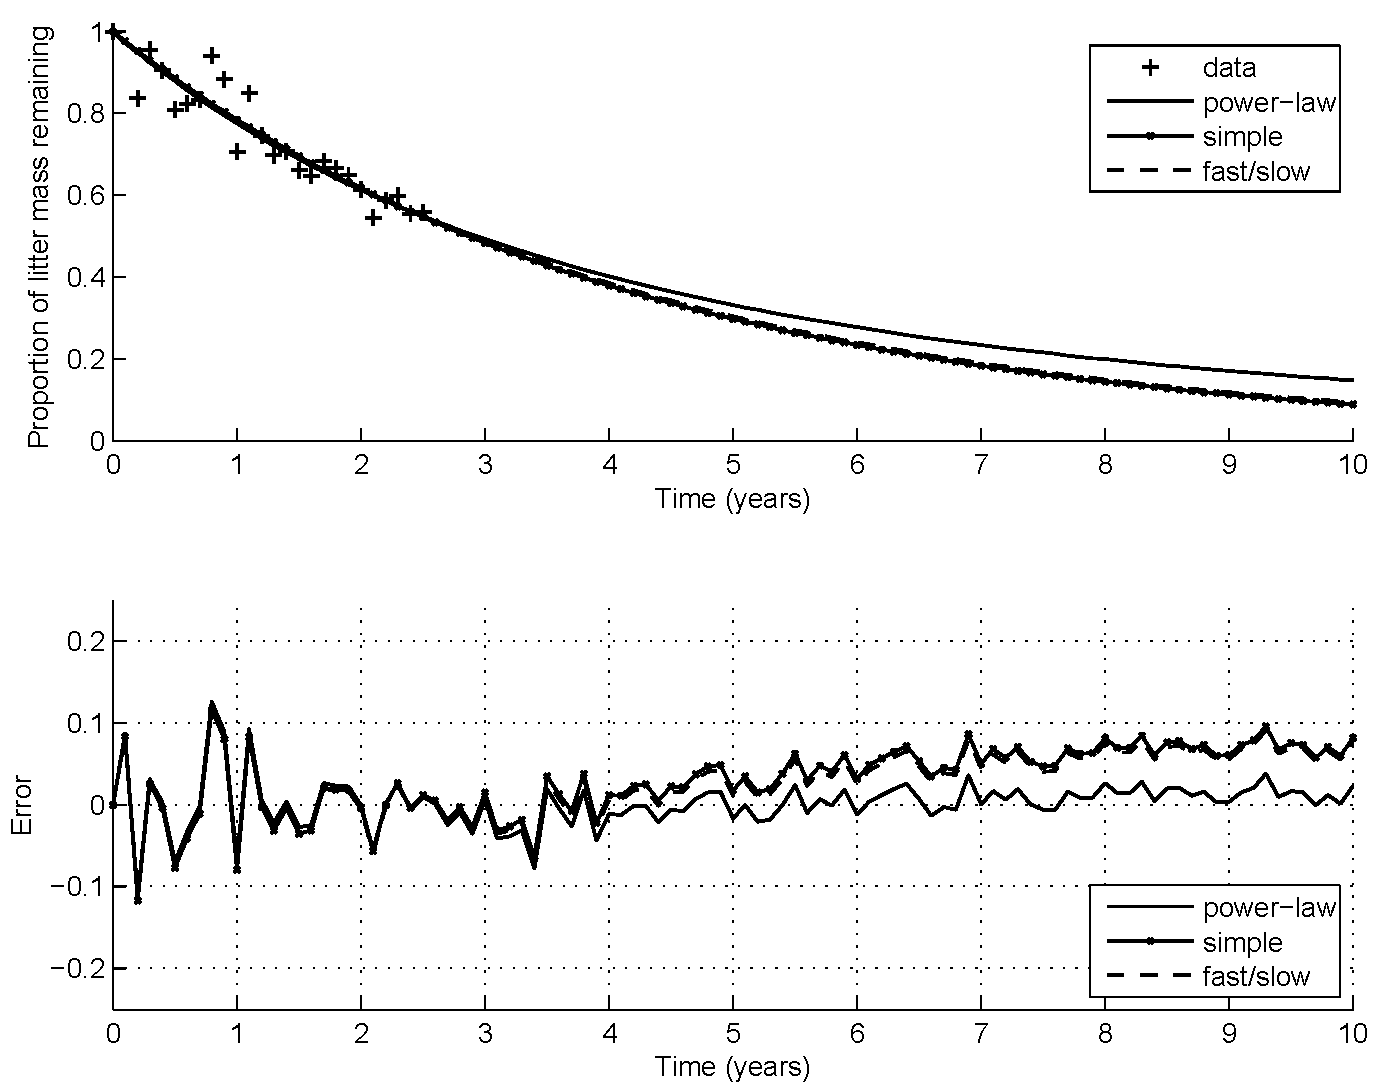
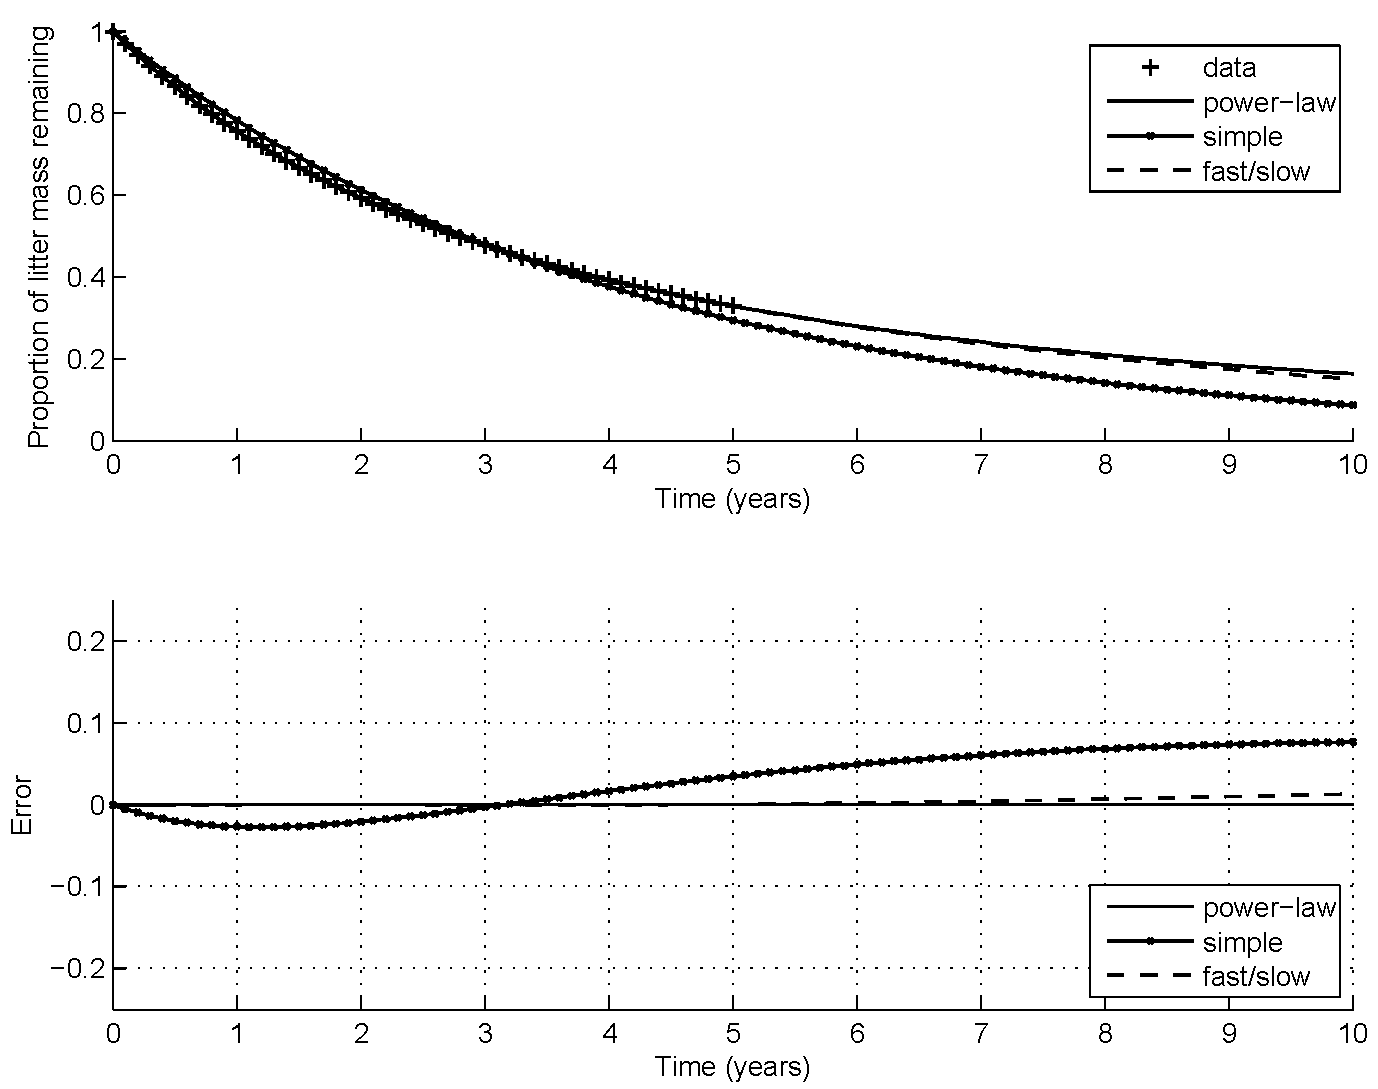
For a single category of decomposable material, e.g., leaves, needles, small twigs, etc., it seems unlikely that there are identifiable fast and slow decomposition compartments over the relevant time scale of months to years. This, then, begs the question of whether the better fit of the double exponential, fast/slow model is due solely to a regression effect, that is overfitting, by using a sum of two simple exponential decay models. To address this question a series of estimation problems was considered using simulated data sets spanning time intervals of different lengths, 2.5 years to 10 years in 2.5 year increments. For each time interval simulated data were generated from a base decomposition profile created using the power law model estiamted from the needle litter data. Models were fit to the simulated data and to the simulated data with 5% noise added. Figures for each time span are presented below as well as tables of the estimated parameter values and 95% confidence intervals for the values.
|


For information send email to:
info@biometricsnw.com
Last Update:
October 20, 2024
Copyright 2005-2024 Biometrics Northwest LLC